Steinmetz
Visual tool for decomposing monolithic Java applications into microservices.
2 min read
What is it?
Steinmetz is a tool I built for my master’s thesis that helps teams decompose monolithic Java applications into microservices through visual analysis and data-driven recommendations. Instead of relying purely on domain knowledge or gut feeling, it analyzes your codebase from multiple angles and suggests where service boundaries should be drawn.
The name comes from the German word for “stonemason” – someone who cuts and shapes stone. Seemed fitting for a tool that breaks apart monoliths.
You can find the paper describing the thesis here.
GitHub: https://github.com/loehnertz/Steinmetz
Why I built it
“Microservices transitions” where the hot topic during the year that I was studying. The problem is that deciding where to draw boundaries is hard, and most advice is vague (“bounded contexts!”) without concrete guidance.
I wanted something that could analyze an actual codebase and provide data-backed recommendations rather than just principles. Not to replace human judgment, but to inform it with concrete metrics.
How it works
Steinmetz analyzes backend code from four different dimensions:
- Static Analysis: Examines source code structure and dependencies (AST)
- Dynamic Analysis: Processes runtime behavior via profiler recordings
- Semantic Analysis: Understands code semantics and relationships through natural language processing
- Evolutionary Analysis: Traces development patterns through version control logs
Using this multi-faceted approach, it employs seven different graph clustering algorithms to identify natural service boundaries within monolithic codebases. A genetic algorithm then optimizes the clustering parameters to produce the best decomposition weights.
flowchart TD
    S["Static Analysis\n(AST & Dependencies)"] --> C["7 Graph Clustering\nAlgorithms"]
    D["Dynamic Analysis\n(Runtime Profiling)"] --> C
    SE["Semantic Analysis\n(NLP Processing)"] --> C
    E["Evolutionary Analysis\n(Version Control)"] --> C
    C --> G["Genetic Algorithm\nOptimization"]
G --> R["Service Boundary\nRecommendations"] Key features:
- Multi-Algorithm Clustering: Seven different algorithms analyze the codebase from different angles
- Genetic Algorithm Optimization: Fine-tunes clustering parameters automatically
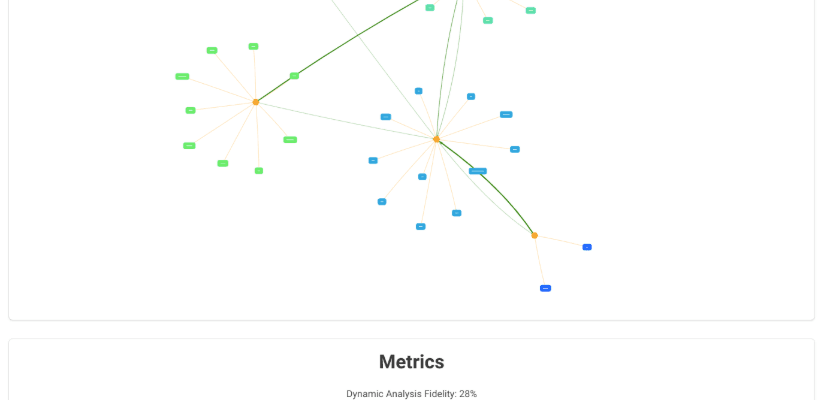
- Advanced Visualization: Three different visualization formats to explore and validate proposed boundaries
- Minimal Requirements: Needs only source code, version control logs, and optionally profiler data
Tech stack
I built Steinmetz with:
- Backend: Kotlin for the analysis engine and API
- Frontend: Vue.js for interactive visualizations
- Database: Neo4j with graph algorithms for relationship analysis
- Deployment: Docker and Docker Compose for containerized setup
The whole software is distributed under the Apache 2.0 license.